
Glenn Beamer, Ph.D.
Assistant Professor, The Bloustein School of Planning & Public Policy
New Jersey’s Transportation Trust Fund is confronting a crisis that has developed over more than a decade under Democratic and Republican Administrations (Robins, 2004). Bond refinancing in early 2005 has provided state elected and administrative officials with time to develop a longer-term solution to this problem. This paper provides a comparative analysis of New Jersey’s transportation financing, trust fund and debt management, and budget pressures and experience in order to advance an understanding of New Jersey’s predicament. The report includes best practices from other states with the intention of making those practices known to policy officials.
This paper has three sections. It begins with a comparative analysis of transportation funding. I investigate the extent to which other states rely on dedicated taxes and user fees to finance their transportation infrastructure and mass transit operations. Recent gas tax changes in states as diverse as Pennsylvania and Utah demonstrate how states have employed new marginal transportation revenues to contend with transportation challenges. The paper then compares debt levels, debt management, and state trust funds. This section draws upon five “Best Practice” states including Maryland, Michigan, Minnesota, Pennsylvania and Washington, as well as “Worst Practice” states, which California, New York and Virginia (Moody’s, 2004). The best practice states all have transportation policies that support principles of accountability, transparency, and affordability. The Worst Practice states, one of which has superior bond ratings, lack in these principles. In the case of Virginia, the state’s lack of current revenues for transportation have left it lurching from one year to the next without an implemented long term plan in the face of greatly increased demand.
The third section of the paper offers policy options that are based upon other states’ best practices and their responses to transportation challenges. These options are presented in the context of New Jersey’s financial situation and with specific attention to the Transportation Trust Fund. All of the options are intended to contribute to government’s accountability, provide the public with financial transparency, and create an affordable long-term transportation plan for New Jersey. A critical assessment of New Jersey’s experience with the Transportation Trust Fund reveals that the current system suffers from a lack of financial parameters and reporting transparency, and that the use of the trust fund to leverage capital via debt issues has overly constrained the state’s near term and future financial resources.
Policy decisions about New Jersey’s transportation funding and its debt practices should be considered in tandem and in the context of the state’s overall budget. Like many states, New Jersey suffered a severe revenue contraction from 2001 through 2003. Although the overall budget is beyond the scope of this paper, it is worth noting that New Jersey’s fiscal situation is likely to remain constrained due to 1) rising Medicaid costs, 2) the loss of its share $20 billion in supplemental federal assistance, 3) competitive pressures on its tax base resulting from increased electronic commerce, and 4) increased demand for spending due to demographic changes and infrastructure depreciation (Behn and Keating, 2004).
New Jersey Gas Tax
All fifty states tax gasoline and motor fuels and to varying extents rely on revenues from these taxes to fund transportation programs and to garner federal funding for highway and road capital projects as well as transportation operations.
Motor fuel taxes in New Jersey remain low relative to other states. Nationally state excise taxes on motor fuels for passenger vehicles averaged 20.3 cents per gallon. New Jersey’s tax rate of 10.5 cents per gallon ranked the state forty-sixth. New Jersey’s combined federal and state taxes, including the four-cent tax added to the motor fuels tax, were 32.9 cents per gallon compared to a national average gas tax of 42.0 cents per gallon. In comparison to its neighbors, New Jersey’s motor fuel taxes remain low. Table 1 presents data regarding state motor fuel taxes.
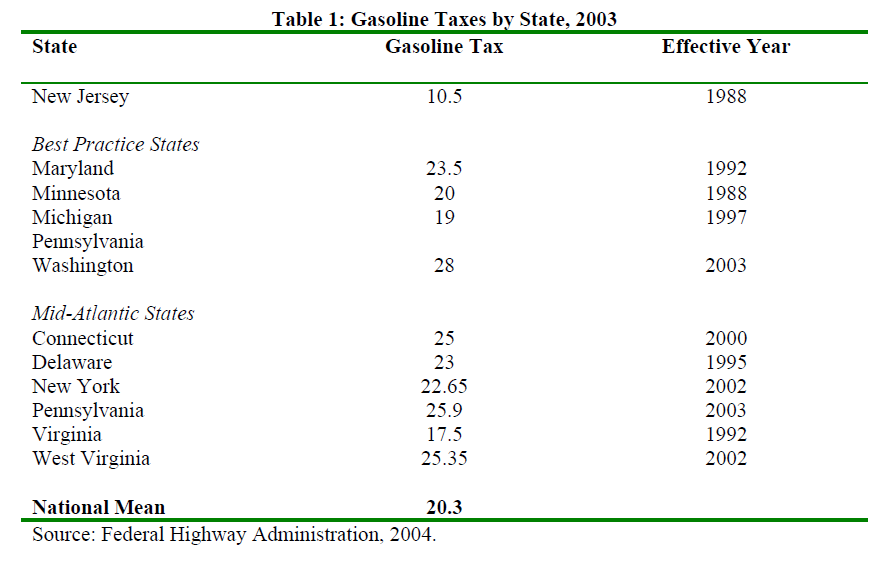
Table 1 reveals that New Jersey’s gas taxes are low relative to the national average tax rate of twenty cents per gallon and relative to the Mid-Atlantic region’s mean tax rate of 23.2 cents per gallon. Importantly, New Jersey’s low effective rate may prevent it from being able to maximize federal funding for transportation and its tax rate is out of line with the federal tax rate of eighteen cents per gallon that became effective in 1997.
As a result of its relatively low tax per gallon, New Jersey has less direct revenue available for its transportation funding based on a variety of measures. As reported to the federal Department of Transportation Federal Highway Administration, New Jersey’s total fuel taxes yield the state only $554 million in revenues and the legislature and governor committed less than $450 million of this amount to the transportation trust fund despite statute that the remainder should be appropriated. Although New Jersey’s 8078 annual per capita vehicle miles traveled are below the national average for all states, which measures 9915, its dense population and its geographic position as a national travel corridor imply that its roads receive heavy use and need substantial maintenance. In the aggregate, New Jersey’s revenues from fuel taxes remitted to the transportation trust fund are comparable to Nevada’s ($414 million) and Arkansas ($436 million); each of which has about 30% of the Garden State’s population.
Currently New Jersey’s motor fuel tax revenues from gasoline and diesel fuel yield $64.50 per New Jersey resident for transportation funding. In the continental forty-eight states, only population-rich New York and California had gas taxes that yielded less than $100 per capita. New Jersey’s stagnant gas tax has positioned it poorly to meet the demands of its commuters and to attract revenues from out-of-state commuters and freight haulers. Among the best practice states, fuel taxes per capita range from a low of $106 per capita in Michigan to a high of $137.50 in Pennsylvania.
The confluence of limited gas tax revenues and retention of trust fund revenues in the general fund has motivated the state to rely on debt to finance transportation. In 2003, bond proceeds provided New Jersey $1.1 billion for transportation whereas state user taxes and revenues contributed a total of $668 million, which amounted to 21% of New Jersey’s available transportation funding. Among the five best practice states, the situation was largely reversed – state user taxes contributed between 39% of funding in Pennsylvania up to 66% of funding in Michigan. Table 2 presents state revenues for transportation by source for 2003.
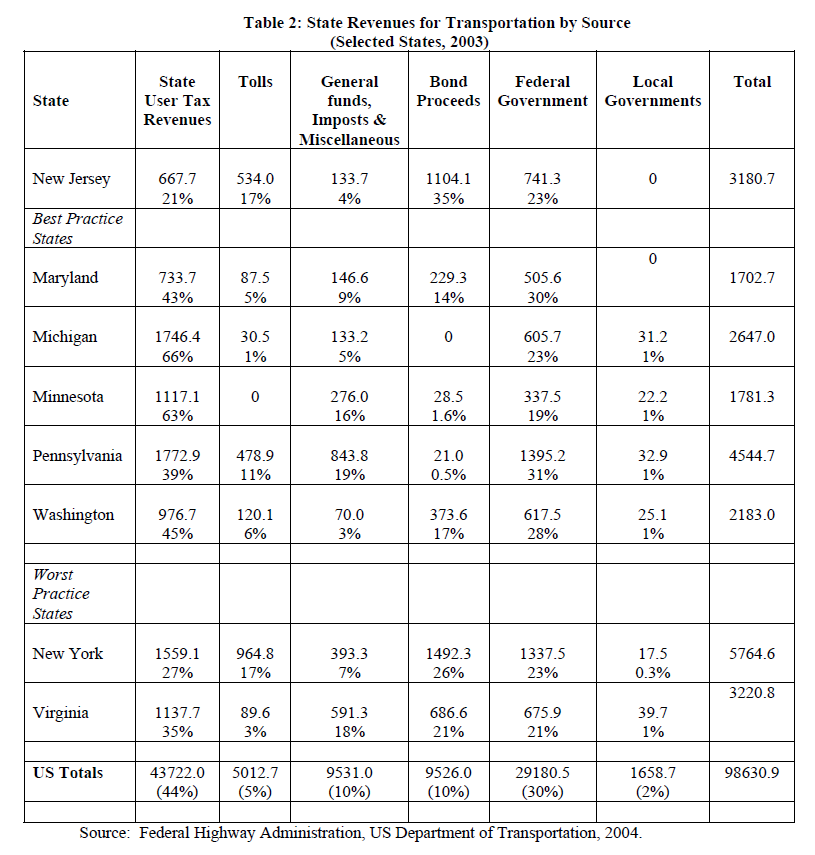
Because its fuel tax revenues are limited and diverted, New Jersey relies very heavily on debt to finance transportation. Among the five best practice states, only Maryland and Washington had debt issues that even approached New Jersey’s $1.1 billion with 2003 debt issues of $230 million and $374 million respectively. In these two states, bond issues accounted for 14% of transportation revenues in Maryland and 17% of transportation revenues in Washington. New Jersey’s reliance on debt even exceeds the comparative worst practice states. New York’s $1.5 billion in 2003 bond issues accounted for 26% of its transportation revenues and Virginia’s $687 million in debt represented 21% of its transportation revenues. In other words, New Jersey has come to rely on debt more heavily and relies least on current user taxes to fund transportation.
Since 1997, fourteen states have voted to raise their gas taxes one or more times and two states have extended previous increases. In none of these states has there been a voter backlash due to increased taxes for dedicated gasoline tax revenues. In ten of the fourteen states enacting increases, Republican governors presided. In many states, such as Pennsylvania, Michigan, and Utah, Republican governors proposed and advocated for gasoline tax increases to ensure funding for transportation infrastructure and to provide sufficient public goods to sustain economic development. In seven of these ten states, Republican majorities controlled both houses of the legislature and on average nearly three-quarters of all state legislators supported gasoline tax increases (ARTBA, 2004).
Among states that have recently enacted gasoline tax increases, three – Michigan, Pennsylvania, and Washington — are particularly relevant to New Jersey’s situation. All three states enacted increases with bipartisan support and addressed some combination of congestion and mass transit, aging infrastructure, a balance of bond and pay-as-you go financing, and assistance to local communities.
Michigan raised its gas tax to 19 cents per gallon in 1997. This increase was the first increase in Michigan’s gas tax since 1984 when the tax increased by 2 cents per gallon to 15 cents (ARBTA, 2003). The 4-cent increase provided the state with an additional $200 million for transportation. In 2003, all user taxes, including gasoline taxes, provided the state with $1.7 billion for state and community transportation. Michigan law directs that proceeds from the gas tax be deposited in the Michigan Transportation Trust Fund as follows:
10% to Comprehensive Transportation Trust Fund
2% of revenue to the Recreation Improvement Fund
$5 million to the Critical Bridge Fund
$3 million to Rail Grade Crossing Account
Transportation Economic Development Fund
Of remaining funds,
39.1% to State Trunkline Fund
39.1% to county road commissions
21.8% to cities and villages
Pennsylvania. In 1997, Governor Tom Ridge (R) approved a 3.5-cent per gallon increase in the gas tax that had been approved by the legislature bringing the state’s tax rate to 25.9 cents per gallon (Federal Highway Administration, 2004). Republicans in the legislature resisted raising taxes when the state was running surpluses. In order to reach a compromise, the bill raising the gas tax included $150 million for mass transit throughout the state and was expected to produce $404 million annually for highway and bridge construction and maintenance. In addition to its motor fuels tax, Pennsylvania has an oil company franchise tax on liquid fuels on a cent-per-gallon equivalent basis (PennDOT, 2004). Revenues from this latter tax are dedicated as follows:
42% to county maintenance districts for highway maintenance
17% for highway capital projects
13% for bridges
2% for bridges identified as forestry bridges
12% for local roads based on allocations to municipalities as found in statute
14% for Toll Roads
Washington. Governor Gary Locke (D) signed legislation in 2003 that raised the gasoline tax from 23 to 28 cents per gallon. The legislation enjoyed bipartisan support and was part of a comprehensive 10-year transportation plan totaling $4.2 billion designed to address the state’s infrastructure depreciation, increased congestion, and multi-modal transportation. Th legislature specifically connected the nickel per gallon increase to the bond financing for the 2003 Comprehensive transportation plan. The increase is scheduled to expire when the state retires all the bonds from the plan (Washington State Transportation Commission & Washington State Department of Transportation, 2002).
A lack of change can hamper a state’s ability to invest in critical infrastructure. New Jersey’s current debt service demands are one of two primary contributing factors to this situation. Virginia is an example of a state in which low gas taxes, which are dedicated to transportation, combined with the effects of a mild recession and large tax cuts in the 1990s to severely limit Virginia’s transportation investments. By most accounts the state is under-investing in its transportation needs and its transportation planning has shifted from long range plans being flexibly implemented over ten year periods to piecemeal decision making in which projects are undertaken based on cash currently available with less concern for priority projects such as capacity expansions designed to accommodate regional population growth.
In addition to the seventeen states in which legislative action sustained or increased revenues from gasoline taxes, eight states relied on variable gas tax rates. Legislators have designed these taxes to automatically adjust based on changes in fuel prices or overall inflation rates. The legislature passes enabling legislation that establishes the variable tax rate and formula for future, typically quarterly or annual, adjustments but does not approve or reject individual adjustment to the tax. In essence these states have removed an element of politics from their dedicated motor fuels tax.
The confluence of a low gas tax and high debt reliance has left New Jersey lagging nearly all of its forty-nine counterparts in transportation funding. This unfortunate circumstance has developed at the same time that the state confronts increasing demands on its roads and bridges, aged transportation infrastructure, and challenges to provide new modes of transportation for both passengers and freight. Table 3 presents data from the National Highway Administration detailing how states have spent available resources.
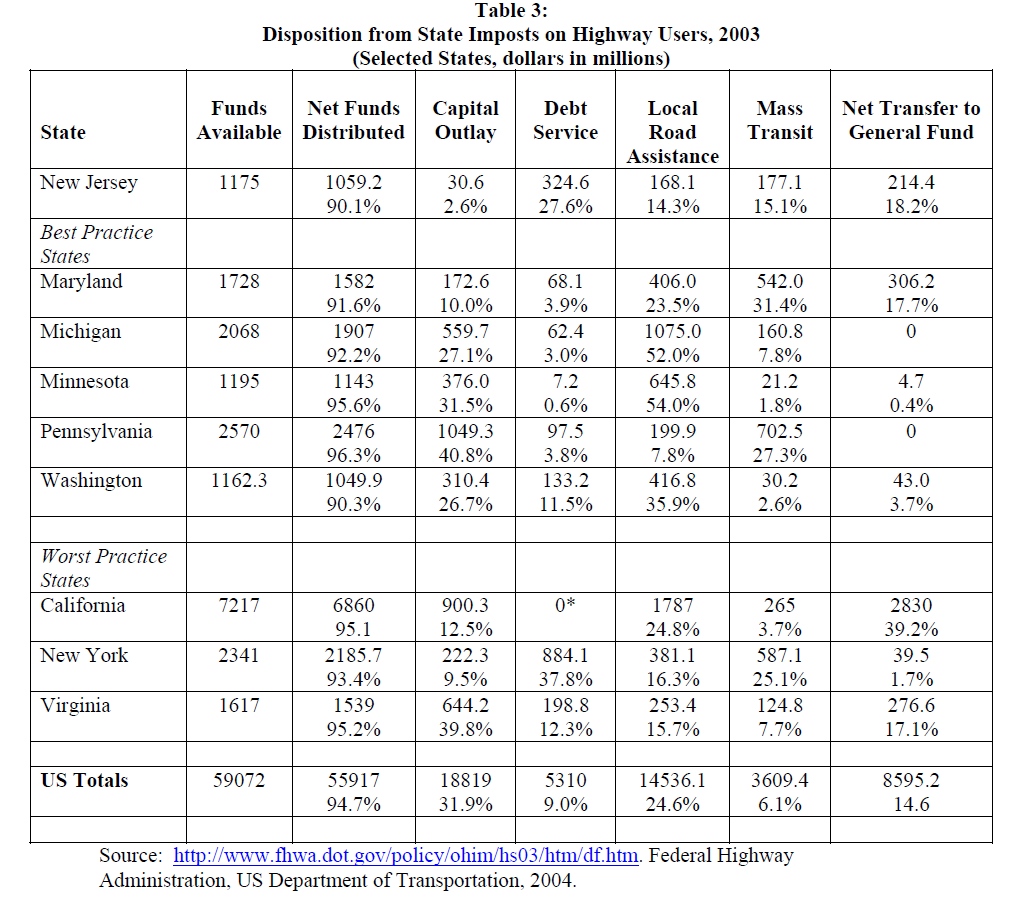
Table 3 brings into strong relief the imbalance in New Jersey’s transportation spending. Whereas the fifty states spend an average of nine percent of their funds on debt service, New Jersey spends three times that proportion with 27.6% of its $1.2 billion in funding being dedicated to debt service. This large commitment to debt service directly and severely constrains the state’s ability to fund a capital program, which is the lowest in the nation. Best practice states commit as little as one percent of their available funds to debt service with a modal commitment of three to five percent. In comparison to worst practice states, New Jersey’s low commitment to capital projects and its high debt service costs actually would place it below both California and New York. Although New Jersey’s credit rating is better than both those states, its ability to finance transportation infrastructure is at best equivalent. All three states are positioned poorly to meet transportation demands within the next five to ten years.
Table 3 reveals three additional anomalies in New Jersey’s transportation expenditures.
These are:
- A very low capital commitment equivalent to only 2.6% of outlays. With the exception of Maryland, best practice states spent a mean of 31% of their funds on capital projects. New Jersey spent just $3.60 per resident on capital outlays compared to an unweighted average of $59.20 among the best practice states. Even New York and California respectively spent $11.40 and $25.60 per capita.
- Low levels of local assistance amounting to only 14.3% of outlays and less than $20 per capita. With the exception of Pennsylvania, local assistance ranged from $68 per capita in Washington to $127 per capita in Minnesota.
- A very high net transfer to the New Jersey’s General Fund. The retention of user taxes by the General Fund constrains the state’s transportation resources by approximately one-fifth. Although the state faces substantial budget challenges, a restructured Trust Fund could make this transfer and its consequences more transparent. California’s practice of transferring billions of dollars, largely for debt service incurred in the general fund to provide transportation resources, is the only state that exceeds New Jersey in having confusing accounting for its transportation resources.
New Jersey’s practice of issuing debt to fund transportation has constrained its funds for current operations and pay-as-you-go capital projects (Robins, 2004). Unfortunately, the state’s practices affecting the Transportation Trust Fund have been embedded within larger government practices of accumulating debt during robust economic times, uneven economic times, and economic contractions. A comparative analysis of state debt management practices reveals that New Jersey’s overall debt burden generally and its debt related to transportation specifically are among the highest debt burdens borne by state citizens (Moody’s, 2004). In order to make revenues available for necessary transportation projects the state must find sufficient cash flow to fund critically necessary pay-as-you-go projects while paying down its extant debt.
State Debt Level Comparisons
New Jersey ranks among the top states in terms of its aggregate debt levels and in terms of debt per capita. In terms of per capita debt, New Jersey’s debt level remains high. In 2003 New Jersey ranked fifth in per capita debt behind only Connecticut, Massachusetts, Hawaii, and New York. In 2003, New Jersey held debt equal to $2,332 per resident, slightly lower than New York’s $2420 per resident but substantially higher than sixth-ranked Delaware’s $1800 per capita debt (Moody’s, 2004). Table 4 indicates that New Jersey ranks fifth among the fifty states in terms of its aggregate debt level of $20.2 billion. Of significant concern should be the growth rate of New Jersey’s state held debt.
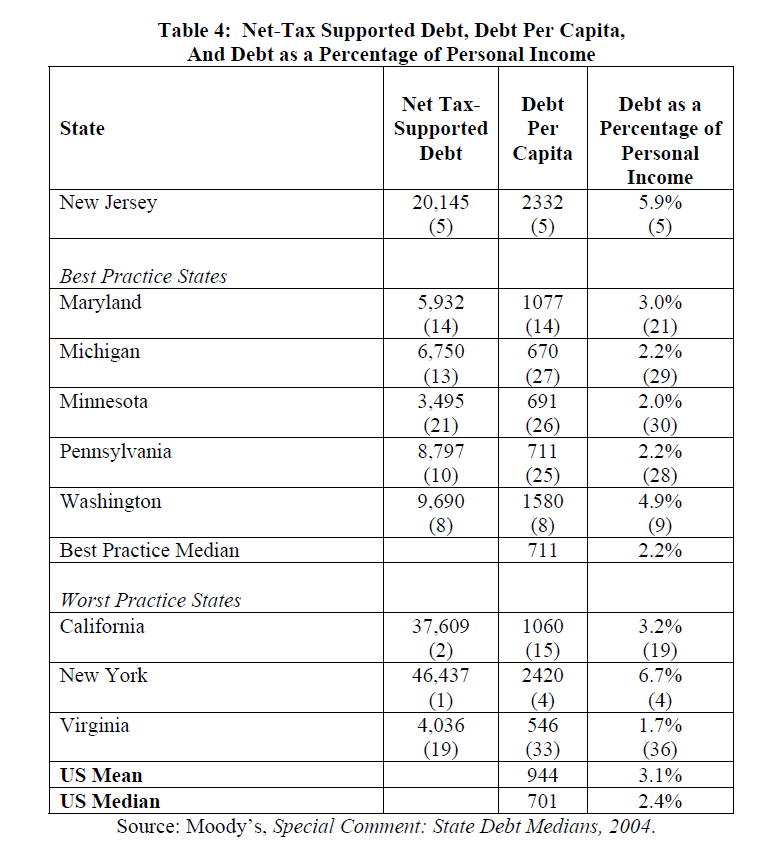
From 1998 through 2003, New Jersey’s publicly issued debt grew from $13.5 billion to $20.15 billion – an increase of 49.6 % in just five years. Only California and Illinois had faster rates of debt growth during this period with California’s debt financing causing the state’s debt rating to deteriorate substantially and leaving the state with increased borrowing costs. Although Illinois’ debt nearly tripled, it is notable that its debt level increased from $8.7 billion to $24.6 billion over this five-year period. In other words, Illinois’ relatively low debt in 1998 contributes to its high rate of debt growth. Conversely, New York’s high debt level of $36.1 billion in 1998 creates an impression of moderate debt growth with a rate of 28.6%, but New York led the nation in terms of its aggregate debt and ranked fourth among all states in per capita debt (Moody’s 2004, Hevesi, 2005).
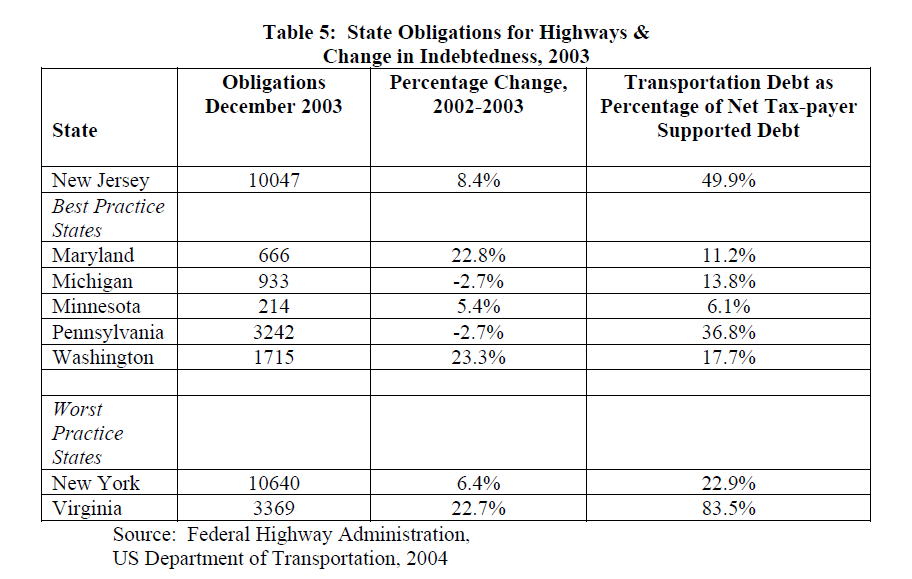
With respect to bonds for transportation financing, New Jersey is second highest behind only New York, and New York’s $500 per capita transportation debt is less than one-half New Jersey’s $1160 per capita transportation debt. New Jersey has relied more heavily on bond financing for transportation capital projects than any other state and it has nearly exhausted revenue streams by having to devote increasingly large proportions of its transportation budget to debt service.
Maryland’s Transportation Trust Fund has clear parameters for debt management and the balance between pay-as-you-go and debt-financed capital projects. The Maryland legislature limits their trust fund’s outstanding debt to $1.5 billion annually and commits the state to share 30% of revenues collected in its Gasoline and Motor Vehicles Revenue Account with localities. The Gasoline and Motor Vehicles Revenue Account receives 100% of Maryland’s motor fuel tax, 80% of its vehicle titling tax, 80% of its rental car sales tax, 100% of the Maryland Department of Transportation’s portion of the state corporate income tax, and a portion of motor vehicle registration fees (Maryland Department of Legislative Services, 2002). The Account remits statutory reductions for Medevac service, uninsured motorist fees, Chesapeake Bay programs, and other miscellaneous charges and state services.
Maryland’s Transportation Trust Fund is subject to limitations including:
- Outstanding debt is capped by statute at $1.5 billion and the legislature sets annual limits below this amount.
- Two statutory coverage tests manage debt outstanding: net revenues (the GMVRA less deductions) and pledged taxes each must be 2.0 times maximum annual debt service. The Maryland Department of Transportation management uses a ratio of 2.5 for this test. Fiscal year 2002 net revenue coverage was 4.1 times the maximum annual debt service and 6.7 times using the pledged taxes test.
- The total amount of debt issued does not exceed the highway construction budget.
- The state Debt Affordability Committee includes transportation debt when it establishes annual limits on State tax supported debt.
Because the 1990s were a time of rapid and sustained economic growth and relatively low interest rates, many states relied on bond financing for capital projects. Following the 1990s economic expansion, many states found themselves with substantially altered tax systems and suffered severe revenue contractions from which they are only now recovering. The fiscal difficulties states have encountered since 2001 have led a number of states to rely on a variety of borrowing strategies for general fund expenditures and to meet intergovernmental obligations. This last development is of special concern because it indicates that bond financing is funding current expenses rather than long-term capital investments that provide sustained economic returns and, in some cases, identifiable revenues. The recommendations following this discussion of state debt management are for New Jersey to restructure the New Jersey Transportation Trust Fund such that both the Trust Fund and New Jersey’s public finances generally benefit from greater affordability, accountability, and transparency in future years.
Recommendations for New Jersey’s Transportation Trust Fund
Unless New Jersey can restructure revenues and expenditures such that debt stabilizes, the state will face recurrent financial crises as it contends with unsustainably high debt levels and cyclical revenues. Although the financial and political crisis facing the Transportation Trust Fund represents only a part of the state’s total indebtedness, it represents a very substantial part. Moving beyond strategies to avert insolvency and toward sound financial management for the Trust Fund can and should redound to the benefit of New Jersey’s finances generally. This section of the report provides policy options for developing sound financial management of the Trust Fund based on best practices from other states and the financial requirements facing the Trust Fund. Although the report does not endorse specific policy alternatives, these options are presented with three principles in mind. These principles are that any financial solution to the Trust Fund crisis should increase government accountability and the trust fund’s and the state’s financial transparency and should be developed in the context of developing a sustainable and affordable transportation plan for New Jersey’s citizens.
- New Revenues must be dedicated debt reduction and high priority capital projects with identified public rates of return
- The Trust Fund should be restructured such that it is no longer derivative of the General Fund. Dedicated taxes should flow directly into the Transportation Trust fund and can only be diverted by 3/5 votes of the legislature and with the Governor’s approval.
- The state needs to establish debt reduction targets for its transportation trust fund. Failure to meet these targets will result in decreased assistance to municipalities and counties. The logic of this connection is to create incentives for legislators to seek and accelerate debt reduction. If they do not reduce debt, then their localities will lose local assistance.
- A Debt Review board should approve a 6-year financial plan that evaluates debt reduction and plans for important transportation projects. This board would have the authority, much like the federal military base closing commission, to defer or cancel projects in the event that the state fails to meet debt reduction targets.
- Once the state achieves its a six-year debt reduction target, parameters should be put in place that will ensure a balance of revenues for operations, revenues for debt service on remaining debt, and revenues for debt service for new bond issues. Failure to continue debt reduction will burden the Trust Fund with perpetual interest payments on debt it holds for capital projects that have long ago depreciated or, worse, for debt that was issued to cover operating expenses. In effect, in the absence of sustained debt reduction, New Jersey tax payers will pay a “Interest Tax.”
- Local Aid is an area in which New Jersey provides localities less assistance than many best practice states. A restructured trust fund could connect local assistance and create a better coordinated system of transportation investments.
These recommendations offer a starting point from which New Jersey policy makers can move forward. By addressing the issues of transportation funding and debt management in tandem, New Jersey can better ensure its long-term economic growth and fiscal health, protects it environment, and develop its communities.
References
American Road & Transportation Builders Association. December 2004. State Gas Tax & User Fee Developments.
American Road & Transportation Builders Association. 2003. State Gas Tax Report. Washington, DC.
Behn, Robert D. and Elizabeth K. Keating. 2004. “Facing the Fiscal Crises in State Governments: National Problem, National Responsibilities.” The Taubman Center for State and Local Government, John F. Kennedy School of Government, Harvard University, Cambridge, Massachusetts.
Hevesi, Alan G. February 2005. New York State’s Debt Policy: A Need for Reform. Office of the State Comptroller, Albany, New York.
Maryland Department of Legislative Services. September 12, 2002. Transportation Trust Fund Overview: Presentation to the Commission of Maryland’s Fiscal Structure. Annapolis, MD: Office of Policy Analysis.
Michigan Department of the Budget. 2003-2004 Comprehensive Annual Financial Report. Lansing, Michigan.
Minnesota Department of Transportation. 2004. Transportation Funding: Where it comes from and where it goes, fiscal year 2003. Minneapolis, Minnesota.
Moody’s. 2004. Special Comment: 2004 State Debt Medians. New York: Moody’s Investor Service.
PennDOT. 2004. PennDOT Annual Report 2003. Harrisburg, PA: Pennsylvania Department of Transportation.
Robins, Martin E. October 2004. “The Crisis in Transportation Finance: Lessons Learned from the New Jersey Experience.” Reprint from The Journal of Transportation, Law, Logistics, & Policy.
United States Department of Transportation, the Federal Highway Administration. 2004. Federal Highway Statistics for 2003.
Washington State Department of Transportation. 2003. 2003 Legislative Session Transportation Results.
Washington State Transportation Commission & Washington State Department of Transportation. November 2002. Straight Talk About Transportation: Building a New Plan for Moving Forward. Olympia Washington.
